A practical approach to flagging anomalies in streaming signals
This is part one of a two-part series. Part one covers outlier detection in one-dimensional signal streams. Part two covers power law noise whitening, which can serve as a useful preprocessing step before detection.
Prerequisites
This topic assumes familiarity with basic statistics (mean, variance, quartiles). No prior DSP knowledge required.
Nature’s outlier detector
A moth’s tympanal organ is a simple threshold detector: it fires when it senses the ultrasonic calls of an approaching bat, triggering evasive maneuvers (Roeder 1962). No spectral analysis, no pattern matching: just “is this signal abnormally loud?” The streaming outlier detectors in this topic work on the same principle: flag values that exceed a robust threshold, with minimal computation and no memory of the full signal history.
Unusual things stick out. Whether it is a sudden spike in a sensor reading, an unexpected pause in network traffic, or a single data point far from the rest. Something in us immediately flags it as worth attention. The identification of rare or unexpected observations is relevant to almost every area of measurement and monitoring, and can be considered a prerequisite for making reliable inferences from data.
Although humans have an intuitive feel for outliers, the concept is genuinely hard to define precisely. Depending on the type of data, its context, and the observer’s intentions, the problem is variously called outlier detection, anomaly detection, change detection, or novelty detection. An outlier might arise from measurement variability, experimental error, or from a genuinely different underlying process. In general terms, outliers are observations that deviate significantly from the bulk of the data. But what counts as significant, and significant relative to what, is exactly what we need to pin down.
This discussion focuses on one-dimensional digital signal processing (DSP): univariate, time-dependent data. We want to detect outliers in a data stream (a time series of samples) and do so in something close to real time.
Defining normality from descriptive statistics
One practical approach assumes that signal values originate from a single distribution, or a mixture of distributions. If we can characterise that distribution statistically, we can define normality and flag values that fall far outside it.
Useful univariate descriptive statistics include:
Quartiles divide the data into four equal parts. \(Q_1\) is the value below which 25% of samples fall, \(Q_2\) (the median) divides the data in half, and \(Q_3\) is the value below which 75% of samples fall.
Measures of central tendency: the arithmetic mean (\(\mu\)), median (\(Q_2\)), and geometric mean. The geometric mean is most appropriate for data expressed as ratios or growth rates, and is only defined for positive values.
Measures of spread: standard deviation (\(\sigma\)), coefficient of variation (CV), interquartile range (IQR), and median absolute deviation (MAD). CV is the ratio of \(\sigma\) to \(\mu\). IQR is \(Q_3 - Q_1\), the spread of the middle half of the data. MAD is the median of the absolute deviations from the data’s median.
A note on terminology: in mathematical statistics, the Gaussian distribution is also called the normal distribution. We deliberately avoid that term here, since “normality” is exactly what we are trying to define for the purposes of outlier detection. Calling the reference distribution “normal” risks circular reasoning.
For a Gaussian distribution, the median equals the mean, \(Q_1 \approx \mu - 0.6745\sigma\) and \(Q_3 \approx \mu + 0.6745\sigma\), and \(\sigma \approx 1.4826 \cdot \text{MAD}\). The relationship between these statistics changes significantly for other distributions: for a skewed Beta distribution, for instance, the mean, median, and quartiles can be spread quite differently.
Threshold-based detection
Given a description of the distribution, we can define fences, thresholds beyond which a value is flagged as an outlier.
Three-sigma rule. For a zero-mean Gaussian process, roughly 4.6% of samples fall outside \(\mu \pm 2\sigma\), and only 0.3% fall outside \(\mu \pm 3\sigma\). Designating samples beyond three sigma as outliers is a common starting point:
\[\text{outlier if } x \notin [\mu - 3\sigma,\; \mu + 3\sigma]\]
Tukey’s fences. Based on the IQR, which is more robust than \(\sigma\) to heavy tails and non-Gaussian distributions. Values are flagged as outliers if they fall outside:
Note that for some distributions (the Cauchy distribution, also called the Lorentzian in physics, being a notable example) the mean and variance are not even defined, making \(\sigma\)-based methods inappropriate. IQR and MAD are safer choices in practice.
MAD-based rule. Similar in structure to the three-sigma rule, but with \(\sigma\) estimated robustly from the MAD rather than computed directly:
\[\hat{\sigma} = c \cdot \text{MAD}, \qquad c \approx 1.4826 \text{ for Gaussian data}\]
The constant \(c\) converts a MAD into a standard deviation and depends on the assumed distribution; it is not the fence multiplier. Substituting into the three-sigma form gives fences at
\[\text{median} \pm k \cdot \text{MAD}\]
where \(k\) now absorbs both, so the familiar “three sigma” corresponds to \(k = 3 \times 1.4826
\approx 4.4\). Keeping the two constants distinct matters, because \(k\) here is not on the same scale as Tukey’s \(k\) for the IQR: the ROC section below works out where each lands. The payoff for the extra bookkeeping is that the MAD resists the influence of outliers on the estimate of spread, which is exactly what you want when trying to detect outliers.
Estimating statistics from a sliding window
For a streaming signal, we cannot know the global distribution in advance. We need to estimate statistics locally, updating them as new samples arrive. A natural approach is a sliding window (or circular buffer): keep the last \(N\) samples in memory and compute statistics over them.
See detector.py for the implementations. The key classes are:
OutlierDetector: IQR-based sliding window
OutlierDetectorMAD: MAD-based sliding window
OutlierDetectorFrugalMAD: recursive frugal estimator (see below)
One subtlety worth noting: the current sample \(x\) should be tested against fences computed from the previous buffer state, before appending. Otherwise the sample influences its own outlier test, biasing fences slightly outward and reducing sensitivity. The effect is small for large windows but can matter when \(N\) is small.
A memory-efficient alternative: recursive estimation
Sliding windows are simple and interpretable, but they require storing \(N\) samples. For resource-constrained systems, or very large \(N\), this can be a problem.
An interesting alternative is an adaptation of the Frugal-1U-Median algorithm(Ma, Muthukrishnan, and Sandler 2014), which estimates the median using a single memory cell. The algorithm drifts toward the new sample by a small step if the sample exceeds the current estimate, and drifts away if it does not. We apply the same idea to both the median and the MAD.
The step size is tied to the MAD estimate itself: as the algorithm converges, the step size shrinks, giving finer adjustments around the settled estimate. Despite using only two memory cells (median and MAD), it holds its own against a sliding window on the test signal below, a surprisingly good trade-off.
Tying the step to the estimate is also where the design bites, in two ways that are worth stating plainly because both are easy to miss and neither shows up as a crash.
A flat stretch collapses the scale estimate. Constant input produces no deviations, so the MAD decays by about 1% per sample, which is correct: a constant signal really has no spread. Left alone it approaches zero without ever reaching it, and fences of near-zero width flag every sample once real signal returns. The implementation therefore floors the MAD at a min_scale parameter and flags nothing while it sits at that floor, so a collapsed scale makes the detector go quiet rather than scream. Silence is the safer failure, but it is a failure: outliers arriving just after a quiet period will be missed.
Recovery is not instant. Growing the estimate back by a fixed fraction of itself would take thousands of samples from a collapsed state, so the MAD steps up by a fraction of the gap between the current estimate and the observed deviation instead. That brings recovery down to tens of samples without disturbing the steady-state calibration, but the detector is still less trustworthy for a while after any abrupt change in signal character.
Beyond those, the classic limitation remains: convergence time from a cold start, during which the estimates are unreliable. The \(k\) multiplier also needs more tuning for non-Gaussian signals, because the frugal estimator does not know the underlying distribution.
Which detector, at which threshold? The ROC curve
Every fence above carries a multiplier \(k\), and every choice of \(k\) trades sensitivity against false alarms: tighten the fences and you catch more genuine outliers along with more noise; loosen them and both counts fall. Comparing two detectors at the same \(k\) is meaningless, because \(k\) multiplies a different spread measure in each. For Gaussian data, Tukey’s standard \(k = 1.5\) on the IQR puts the fences at \(0.674\sigma + 1.5 \times 1.349\sigma \approx 2.7\sigma\), and \(k = 4\) on the MAD puts them at \(4 \times 0.674\sigma \approx 2.7\sigma\) as well; the numbers differ while the fences coincide. (This is why OutlierDetectorMAD defaults to \(k = 4\) rather than to Tukey’s 1.5, which on MAD units would sit at only \(\pm 1.0\sigma\) and flag about a third of clean Gaussian samples.)
The fair comparison is the receiver operating characteristic (ROC) curve: sweep the threshold over its whole range, and for each setting plot the fraction of genuine outliers caught (the true positive rate) against the fraction of clean samples wrongly flagged (the false positive rate). Each detector traces a curve; whichever curve passes closer to the top-left corner (catch everything, flag nothing) wins, regardless of how its threshold is parameterised.
import numpy as npimport matplotlib.pyplot as pltfrom detector import OutlierDetector, OutlierDetectorMAD, OutlierDetectorFrugalMAD# Test signal: sine + drift + noise, with 8 injected spikes at known positionsrng = np.random.default_rng(42)N =500t = np.arange(N)signal =0.5* np.sin(2* np.pi * t /80) +0.002* t +0.15* rng.standard_normal(N)outlier_idx = np.array([47, 123, 198, 257, 310, 355, 401, 462])outlier_sign = rng.choice([-1, 1], size=len(outlier_idx))signal[outlier_idx] += outlier_sign * rng.uniform(1.5, 3.0, size=len(outlier_idx))true_set =set(outlier_idx)n_out, n_norm =len(outlier_idx), N -len(outlier_idx)def sweep(make_detector, k_values):"""Run the detector at each threshold; return (fpr, tpr) arrays.""" tpr, fpr = [], []for k in k_values: det = make_detector(k) flagged =set(np.where([bool(det.process(x)) for x in signal])[0]) tpr.append(len(flagged & true_set) / n_out) fpr.append(len(flagged - true_set) / n_norm)return np.array(fpr), np.array(tpr)k_values = np.linspace(0.5, 5.0, 30)buf =51curves = {"IQR window": sweep(lambda k: OutlierDetector(buffer_size=buf, k=k), k_values),"MAD window": sweep(lambda k: OutlierDetectorMAD(buffer_size=buf, k=k), k_values),"FrugalMAD": sweep(lambda k: OutlierDetectorFrugalMAD(k=k), k_values),}fig, ax = plt.subplots(figsize=(6, 5))ax.plot([0, 1], [0, 1], 'k:', lw=0.8, label="chance (flag at random)")for (name, (fpr, tpr)), style inzip(curves.items(), ["o-", "s-", "^-"]): ax.plot(fpr, tpr, style, ms=3, lw=1.2, label=name)ax.set_xlabel("False positive rate")ax.set_ylabel("True positive rate")ax.set_title("ROC curves, threshold k swept from 0.5 to 5")ax.set_xlim(-0.02, 1.0); ax.set_ylim(-0.02, 1.05)ax.legend(fontsize=8)ax.grid(True, alpha=0.3)plt.tight_layout()plt.show()# Self-checks for the claims in the caption and the text below.# 1. Every detector beats flagging at random: no point below the diagonal.for name, (fpr, tpr) in curves.items():assert np.all(tpr >= fpr), f"{name}: a swept point fell below the chance line"# 2. Every detector reaches a strong operating point somewhere in the sweep.for name, (fpr, tpr) in curves.items():assert np.any((tpr >=0.75) & (fpr <=0.01)), \f"{name} never reaches high TPR at low FPR"# 3. The windowed detectors cap at 7 of 8 spikes; the frugal one gets all 8.# The miss is the spike at sample 47, inside the 51-sample buffer fill.for name in ("IQR window", "MAD window"):assert curves[name][1].max() ==7/ n_out, \f"{name} should top out at 7 of 8 spikes"assert curves["FrugalMAD"][1].max() ==1.0, "FrugalMAD should catch all 8"for name, (fpr, tpr) in curves.items(): # best operating point each best = np.argmax(tpr - fpr)print(f"{name:>12s} at k={k_values[best]:.2f}: "f"TPR={tpr[best]:.2f}, FPR={fpr[best]:.3f}")
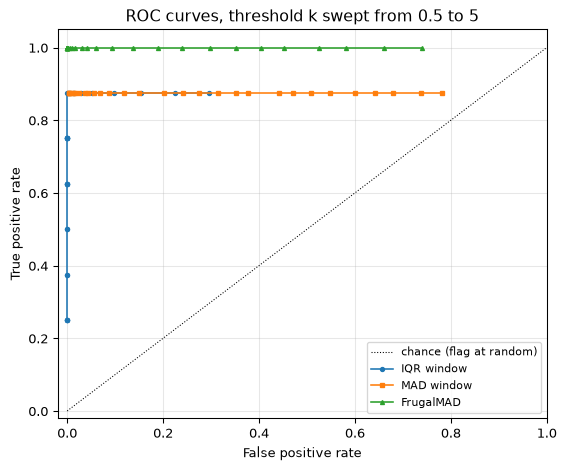
Figure 1: ROC curves for the three streaming detectors on a 500-sample test signal with 8 injected spikes, sweeping the threshold k from 0.5 to 5. All three bend sharply toward the top-left corner. The frugal detector reaches the corner outright on this signal, catching all 8 spikes with no false alarms, while both windowed detectors cap at 7 of 8: the spike at sample 47 arrives before their 51-sample buffer has filled.
  IQR window at k=2.21: TPR=0.88, FPR=0.000
  MAD window at k=4.69: TPR=0.88, FPR=0.004
   FrugalMAD at k=3.45: TPR=1.00, FPR=0.000
Reading the curves: all three bend sharply toward the top-left, and all three reach a true positive rate of at least 0.75 while flagging under 1% of clean samples. Both sliding-window detectors cap at 0.88, or 7 of the 8 spikes. The one they never catch is the first, at sample 47, which arrives before the 51-sample buffer has filled: a window detector is blind until its window is full, which is its own kind of warm-up. Between them, the IQR window loses sensitivity faster as \(k\) grows, since each unit of \(k\) adds a full IQR (about \(1.3\sigma\)) to the fence on each side, against \(0.67\sigma\) per unit for MAD-based fences.
The frugal detector reaches the corner outright here, catching all 8 spikes with no false alarms. That result deserves scepticism rather than applause, and looking at its internal state explains it. Its median tracks the underlying sine with an average error of about 0.37, because its step size (roughly 0.004 per sample) is an order of magnitude too small to follow a signal that moves by up to 0.04 per sample. That lag inflates the deviations it sees, so its MAD settles near 0.37 against a true noise MAD of about 0.10, and at the same \(k\) its fences run about 40% wider than a 51-sample window’s. The injected spikes (amplitude 1.5 to 3.0) clear even those wider fences, and no clean sample does. It wins on this signal partly by being loosely tuned in a way that happens to suit these outliers, and partly through the genuine advantage of having no buffer-fill blind spot.
The honest reading is that the ranking is a property of this signal, not of the algorithms. Re-running with weaker spikes (amplitudes 0.5 to 0.9 instead of 1.5 to 3.0) keeps the frugal detector competitive but drops every detector to a true positive rate near 0.6 to 0.75 with false positive rates above 9%. Nothing here says the \(O(1)\) detector is generally better; it says that on a slowly-varying signal with large, sparse spikes, two memory cells are enough. Choose on your own data, and read the section above on where the frugal estimator does break.
One caution about the axes: with only 8 true outliers, each true positive step is a 12.5% jump in TPR, so the vertical placement of these curves is coarse. The horizontal axis (nearly 500 clean samples) is far better resolved. ROC curves from small event counts are honest about ranking detectors but imprecise about absolute detection rates, and the gap between 0.88 and 1.00 above is a single sample.
The threshold trade-off you see here is not specific to outlier detection: choosing an operating point on a ROC curve is the central act of statistical detection theory, and matched filtering shows the filter that makes the curve as favourable as it can be for a known pulse in noise.
Summary
Three practical outlier detectors for streaming one-dimensional signals, all based on robust statistics (IQR or MAD) rather than mean and standard deviation:
Method
Memory
Latency
Notes
IQR sliding window
\(O(N)\)
Low
Simple, slight self-contamination bias; blind until the buffer fills
MAD sliding window
\(O(N)\)
Low
Less biased, noisier fences; blind until the buffer fills
Frugal MAD
\(O(1)\)
Low
Minimal memory, no buffer-fill blind spot; needs tuning, lags fast-moving signals, goes quiet after a flat stretch
Detection is only part of the problem. Once an outlier is flagged, you still need to decide what to do with it: discard it, replace it with an interpolated value, or trigger an alert. That is a separate problem not covered here, but it is worth designing for from the start.
In practice, the signal arriving at the detector may not be white noise; it may exhibit correlated samples and a non-flat power spectrum. This can cause any of the above methods to behave poorly. Part two discusses power law noise, how to characterise it, and how to whiten it before detection.
References
Ma, Qiang, S. Muthukrishnan, and Mark Sandler. 2014. “Frugal Streaming for Estimating Quantiles: One (or Two) Memory Suffices.” arXiv:1407.1121. https://doi.org/10.48550/arXiv.1407.1121.
Roeder, Kenneth D. 1962. “The Behaviour of Free Flying Moths in the Presence of Artificial Ultrasonic Pulses.”Animal Behaviour 10 (3-4): 300–304.
Source Code
---title: "Outlier Detection"subtitle: "A practical approach to flagging anomalies in streaming signals"---*This is part one of a two-part series. Part one covers outlier detection in one-dimensionalsignal streams. [Part two](../noise-whitening/index.qmd) covers power law noise whitening,which can serve as a useful preprocessing step before detection.*::: {.callout-note title="Prerequisites"}This topic assumes familiarity with basic statistics (mean, variance, quartiles). No prior DSP knowledge required.:::<hr>::: {.callout-tip title="Nature's outlier detector" appearance="simple"}A moth's tympanal organ is a simple threshold detector: it fires when it senses the ultrasonic calls of an approaching bat, triggering evasive maneuvers [@roeder1962behaviour]. No spectral analysis, no pattern matching: just "is this signal abnormally loud?" The streaming outlier detectors in this topic work on the same principle: flag values that exceed a robust threshold, with minimal computation and no memory of the full signal history.:::Unusual things stick out. Whether it is a sudden spike in a sensor reading, an unexpectedpause in network traffic, or a single data point far from the rest. Something in usimmediately flags it as worth attention. The identification of rare or unexpectedobservations is relevant to almost every area of measurement and monitoring, and can beconsidered a prerequisite for making reliable inferences from data.Although humans have an intuitive feel for outliers, the concept is genuinely hard to defineprecisely. Depending on the type of data, its context, and the observer's intentions, theproblem is variously called outlier detection, anomaly detection, change detection, or noveltydetection. An outlier might arise from measurement variability, experimental error, or from agenuinely different underlying process. In general terms, outliers are observations thatdeviate significantly from the bulk of the data. But what counts as significant, andsignificant relative to what, is exactly what we need to pin down.This discussion focuses on one-dimensional digital signal processing (DSP): univariate,time-dependent data. We want to detect outliers in a data stream (a time series of samples)and do so in something close to real time.<hr>## Defining normality from descriptive statisticsOne practical approach assumes that signal values originate from a single distribution, or amixture of distributions. If we can characterise that distribution statistically, we candefine normality and flag values that fall far outside it.Useful univariate descriptive statistics include:- **Quartiles** divide the data into four equal parts. $Q_1$ is the value below which 25% of samples fall, $Q_2$ (the median) divides the data in half, and $Q_3$ is the value below which 75% of samples fall.- **Measures of central tendency**: the arithmetic mean ($\mu$), median ($Q_2$), and geometric mean. The geometric mean is most appropriate for data expressed as ratios or growth rates, and is only defined for positive values.- **Measures of spread**: standard deviation ($\sigma$), coefficient of variation (CV), interquartile range (IQR), and median absolute deviation (MAD). CV is the ratio of $\sigma$ to $\mu$. IQR is $Q_3 - Q_1$, the spread of the middle half of the data. MAD is the median of the absolute deviations from the data's median.A note on terminology: in mathematical statistics, the Gaussian distribution is also calledthe *normal* distribution. We deliberately avoid that term here, since "normality" is exactlywhat we are trying to define for the purposes of outlier detection. Calling the referencedistribution "normal" risks circular reasoning.For a Gaussian distribution, the median equals the mean, $Q_1 \approx \mu - 0.6745\sigma$ and $Q_3 \approx \mu + 0.6745\sigma$, and $\sigma \approx 1.4826 \cdot \text{MAD}$. The relationship between these statistics changessignificantly for other distributions: for a skewed Beta distribution, for instance, themean, median, and quartiles can be spread quite differently.<hr>## Threshold-based detectionGiven a description of the distribution, we can define fences, thresholds beyond which avalue is flagged as an outlier.**Three-sigma rule.** For a zero-mean Gaussian process, roughly 4.6% of samples fall outside$\mu \pm 2\sigma$, and only 0.3% fall outside $\mu \pm 3\sigma$. Designating samples beyond three sigma asoutliers is a common starting point:$$\text{outlier if } x \notin [\mu - 3\sigma,\; \mu + 3\sigma]$$**Tukey's fences.** Based on the IQR, which is more robust than $\sigma$ to heavy tails andnon-Gaussian distributions. Values are flagged as outliers if they fall outside:$$[Q_1 - 1.5 \cdot \text{IQR},\;\; Q_3 + 1.5 \cdot \text{IQR}]$$Note that for some distributions (the Cauchy distribution, also called the Lorentzian in physics, being a notable example) themean and variance are not even defined, making $\sigma$-based methods inappropriate. IQR and MADare safer choices in practice.**MAD-based rule.** Similar in structure to the three-sigma rule, but with $\sigma$ estimatedrobustly from the MAD rather than computed directly:$$\hat{\sigma} = c \cdot \text{MAD}, \qquad c \approx 1.4826 \text{ for Gaussian data}$$The constant $c$ converts a MAD into a standard deviation and depends on the assumeddistribution; it is not the fence multiplier. Substituting into the three-sigma form givesfences at$$\text{median} \pm k \cdot \text{MAD}$$where $k$ now absorbs both, so the familiar "three sigma" corresponds to $k = 3 \times 1.4826\approx 4.4$. Keeping the two constants distinct matters, because $k$ here is not on the samescale as Tukey's $k$ for the IQR: the [ROC section](#which-detector-at-which-threshold-the-roc-curve)below works out where each lands. The payoff for the extra bookkeeping is that the MAD resiststhe influence of outliers on the estimate of spread, which is exactly what you want whentrying to detect outliers.<hr>## Estimating statistics from a sliding windowFor a streaming signal, we cannot know the global distribution in advance. We need toestimate statistics locally, updating them as new samples arrive. A natural approach is a**sliding window** (or circular buffer): keep the last $N$ samples in memory and computestatistics over them.See [`detector.py`](detector.py) for the implementations. The key classes are:- `OutlierDetector`: IQR-based sliding window- `OutlierDetectorMAD`: MAD-based sliding window- `OutlierDetectorFrugalMAD`: recursive frugal estimator (see below)One subtlety worth noting: the current sample $x$ should be tested against fences computedfrom the *previous* buffer state, before appending. Otherwise the sample influences its ownoutlier test, biasing fences slightly outward and reducing sensitivity. The effect is small forlarge windows but can matter when $N$ is small.<hr>## A memory-efficient alternative: recursive estimationSliding windows are simple and interpretable, but they require storing $N$ samples. Forresource-constrained systems, or very large $N$, this can be a problem.An interesting alternative is an adaptation of the **Frugal-1U-Median algorithm** [@ma2014frugal],which estimates the median using a single memory cell. The algorithm drifts toward the newsample by a small step if the sample exceeds the current estimate, and drifts away if it doesnot. We apply the same idea to both the median and the MAD.The step size is tied to the MAD estimate itself: as the algorithm converges, the step sizeshrinks, giving finer adjustments around the settled estimate. Despite using only two memorycells (median and MAD), it holds its own against a sliding window on the test signal below, asurprisingly good trade-off.Tying the step to the estimate is also where the design bites, in two ways that are worthstating plainly because both are easy to miss and neither shows up as a crash.**A flat stretch collapses the scale estimate.** Constant input produces no deviations, so theMAD decays by about 1% per sample, which is correct: a constant signal really has no spread.Left alone it approaches zero without ever reaching it, and fences of near-zero width flagevery sample once real signal returns. The implementation therefore floors the MAD at a`min_scale` parameter and flags nothing while it sits at that floor, so a collapsed scalemakes the detector go quiet rather than scream. Silence is the safer failure, but it *is* afailure: outliers arriving just after a quiet period will be missed.**Recovery is not instant.** Growing the estimate back by a fixed fraction of itself would takethousands of samples from a collapsed state, so the MAD steps up by a fraction of the *gap*between the current estimate and the observed deviation instead. That brings recovery down totens of samples without disturbing the steady-state calibration, but the detector is stillless trustworthy for a while after any abrupt change in signal character.Beyond those, the classic limitation remains: convergence time from a cold start, during whichthe estimates are unreliable. The $k$ multiplier also needs more tuning for non-Gaussiansignals, because the frugal estimator does not know the underlying distribution.<hr>## Which detector, at which threshold? The ROC curveEvery fence above carries a multiplier $k$, and every choice of $k$ trades sensitivity against false alarms: tighten the fences and you catch more genuine outliers along with more noise; loosen them and both counts fall. Comparing two detectors at the same $k$ is meaningless, because $k$ multiplies a different spread measure in each. For Gaussian data, Tukey's standard $k = 1.5$ on the IQR puts the fences at $0.674\sigma + 1.5 \times 1.349\sigma \approx 2.7\sigma$, and $k = 4$ on the MAD puts them at $4 \times 0.674\sigma \approx 2.7\sigma$ as well; the *numbers* differ while the *fences* coincide. (This is why `OutlierDetectorMAD` defaults to $k = 4$ rather than to Tukey's 1.5, which on MAD units would sit at only $\pm 1.0\sigma$ and flag about a third of clean Gaussian samples.)The fair comparison is the **receiver operating characteristic** (ROC) curve: sweep the threshold over its whole range, and for each setting plot the fraction of genuine outliers caught (the true positive rate) against the fraction of clean samples wrongly flagged (the false positive rate). Each detector traces a curve; whichever curve passes closer to the top-left corner (catch everything, flag nothing) wins, regardless of how its threshold is parameterised.```{python}#| label: fig-roc#| fig-cap: "ROC curves for the three streaming detectors on a 500-sample test signal with 8 injected spikes, sweeping the threshold k from 0.5 to 5. All three bend sharply toward the top-left corner. The frugal detector reaches the corner outright on this signal, catching all 8 spikes with no false alarms, while both windowed detectors cap at 7 of 8: the spike at sample 47 arrives before their 51-sample buffer has filled."import numpy as npimport matplotlib.pyplot as pltfrom detector import OutlierDetector, OutlierDetectorMAD, OutlierDetectorFrugalMAD# Test signal: sine + drift + noise, with 8 injected spikes at known positionsrng = np.random.default_rng(42)N =500t = np.arange(N)signal =0.5* np.sin(2* np.pi * t /80) +0.002* t +0.15* rng.standard_normal(N)outlier_idx = np.array([47, 123, 198, 257, 310, 355, 401, 462])outlier_sign = rng.choice([-1, 1], size=len(outlier_idx))signal[outlier_idx] += outlier_sign * rng.uniform(1.5, 3.0, size=len(outlier_idx))true_set =set(outlier_idx)n_out, n_norm =len(outlier_idx), N -len(outlier_idx)def sweep(make_detector, k_values):"""Run the detector at each threshold; return (fpr, tpr) arrays.""" tpr, fpr = [], []for k in k_values: det = make_detector(k) flagged =set(np.where([bool(det.process(x)) for x in signal])[0]) tpr.append(len(flagged & true_set) / n_out) fpr.append(len(flagged - true_set) / n_norm)return np.array(fpr), np.array(tpr)k_values = np.linspace(0.5, 5.0, 30)buf =51curves = {"IQR window": sweep(lambda k: OutlierDetector(buffer_size=buf, k=k), k_values),"MAD window": sweep(lambda k: OutlierDetectorMAD(buffer_size=buf, k=k), k_values),"FrugalMAD": sweep(lambda k: OutlierDetectorFrugalMAD(k=k), k_values),}fig, ax = plt.subplots(figsize=(6, 5))ax.plot([0, 1], [0, 1], 'k:', lw=0.8, label="chance (flag at random)")for (name, (fpr, tpr)), style inzip(curves.items(), ["o-", "s-", "^-"]): ax.plot(fpr, tpr, style, ms=3, lw=1.2, label=name)ax.set_xlabel("False positive rate")ax.set_ylabel("True positive rate")ax.set_title("ROC curves, threshold k swept from 0.5 to 5")ax.set_xlim(-0.02, 1.0); ax.set_ylim(-0.02, 1.05)ax.legend(fontsize=8)ax.grid(True, alpha=0.3)plt.tight_layout()plt.show()# Self-checks for the claims in the caption and the text below.# 1. Every detector beats flagging at random: no point below the diagonal.for name, (fpr, tpr) in curves.items():assert np.all(tpr >= fpr), f"{name}: a swept point fell below the chance line"# 2. Every detector reaches a strong operating point somewhere in the sweep.for name, (fpr, tpr) in curves.items():assert np.any((tpr >=0.75) & (fpr <=0.01)), \f"{name} never reaches high TPR at low FPR"# 3. The windowed detectors cap at 7 of 8 spikes; the frugal one gets all 8.# The miss is the spike at sample 47, inside the 51-sample buffer fill.for name in ("IQR window", "MAD window"):assert curves[name][1].max() ==7/ n_out, \f"{name} should top out at 7 of 8 spikes"assert curves["FrugalMAD"][1].max() ==1.0, "FrugalMAD should catch all 8"for name, (fpr, tpr) in curves.items(): # best operating point each best = np.argmax(tpr - fpr)print(f"{name:>12s} at k={k_values[best]:.2f}: "f"TPR={tpr[best]:.2f}, FPR={fpr[best]:.3f}")```Reading the curves: all three bend sharply toward the top-left, and all three reach a true positive rate of at least 0.75 while flagging under 1% of clean samples. Both sliding-window detectors cap at 0.88, or 7 of the 8 spikes. The one they never catch is the first, at sample 47, which arrives before the 51-sample buffer has filled: a window detector is blind until its window is full, which is its own kind of warm-up. Between them, the IQR window loses sensitivity faster as $k$ grows, since each unit of $k$ adds a full IQR (about $1.3\sigma$) to the fence on each side, against $0.67\sigma$ per unit for MAD-based fences.The frugal detector reaches the corner outright here, catching all 8 spikes with no false alarms. That result deserves scepticism rather than applause, and looking at its internal state explains it. Its median tracks the underlying sine with an average error of about 0.37, because its step size (roughly 0.004 per sample) is an order of magnitude too small to follow a signal that moves by up to 0.04 per sample. That lag inflates the deviations it sees, so its MAD settles near 0.37 against a true noise MAD of about 0.10, and at the same $k$ its fences run about 40% wider than a 51-sample window's. The injected spikes (amplitude 1.5 to 3.0) clear even those wider fences, and no clean sample does. It wins on this signal partly by being loosely tuned in a way that happens to suit these outliers, and partly through the genuine advantage of having no buffer-fill blind spot.The honest reading is that the ranking is a property of *this* signal, not of the algorithms. Re-running with weaker spikes (amplitudes 0.5 to 0.9 instead of 1.5 to 3.0) keeps the frugal detector competitive but drops every detector to a true positive rate near 0.6 to 0.75 with false positive rates above 9%. Nothing here says the $O(1)$ detector is generally better; it says that on a slowly-varying signal with large, sparse spikes, two memory cells are enough. Choose on your own data, and read the section above on where the frugal estimator does break.One caution about the axes: with only 8 true outliers, each true positive step is a 12.5% jump in TPR, so the vertical placement of these curves is coarse. The horizontal axis (nearly 500 clean samples) is far better resolved. ROC curves from small event counts are honest about ranking detectors but imprecise about absolute detection rates, and the gap between 0.88 and 1.00 above is a single sample.The threshold trade-off you see here is not specific to outlier detection: choosing an operating point on a ROC curve is the central act of statistical detection theory, and [matched filtering](../matched-filtering/index.qmd) shows the filter that makes the curve as favourable as it can be for a known pulse in noise.<hr>## SummaryThree practical outlier detectors for streaming one-dimensional signals, all based on robuststatistics (IQR or MAD) rather than mean and standard deviation:| Method | Memory | Latency | Notes ||---|---|---|---|| IQR sliding window | $O(N)$ | Low | Simple, slight self-contamination bias; blind until the buffer fills || MAD sliding window | $O(N)$ | Low | Less biased, noisier fences; blind until the buffer fills || Frugal MAD | $O(1)$ | Low | Minimal memory, no buffer-fill blind spot; needs tuning, lags fast-moving signals, goes quiet after a flat stretch |Detection is only part of the problem. Once an outlier is flagged, you still need to decidewhat to do with it: discard it, replace it with an interpolated value, or trigger an alert.That is a separate problem not covered here, but it is worth designing for from the start.In practice, the signal arriving at the detector may not be white noise; it may exhibitcorrelated samples and a non-flat power spectrum. This can cause any of the above methods tobehave poorly. [Part two](../noise-whitening/index.qmd) discusses power law noise, how tocharacterise it, and how to whiten it before detection.## References::: {#refs}:::