Truncate a 24-bit audio sample to 16 bits and you get harmonic distortion; the quantisation error is correlated with the signal, and the correlation is not subtle. Add a small amount of noise before truncating and the distortion disappears; the result resolves signal detail below the least significant bit (Vanderkooy and Lipshitz 1984). The noise floor rises by a couple of decibels, but the harmonics are gone.
This is dither: deliberately adding noise to linearise a nonlinear system. It is one of the few DSP techniques where you add noise to improve the result, and it is criminally underexposed in DSP education. The finite word-length topic mentions it in passing; this page gives it the treatment it deserves.
The companion module dither.py implements quantisation with and without dither from first principles.
The implementation is dither.py. Save test_dither.py beside it and pytest test_dither.py runs the checks on it.
The problem: signal-correlated quantisation error
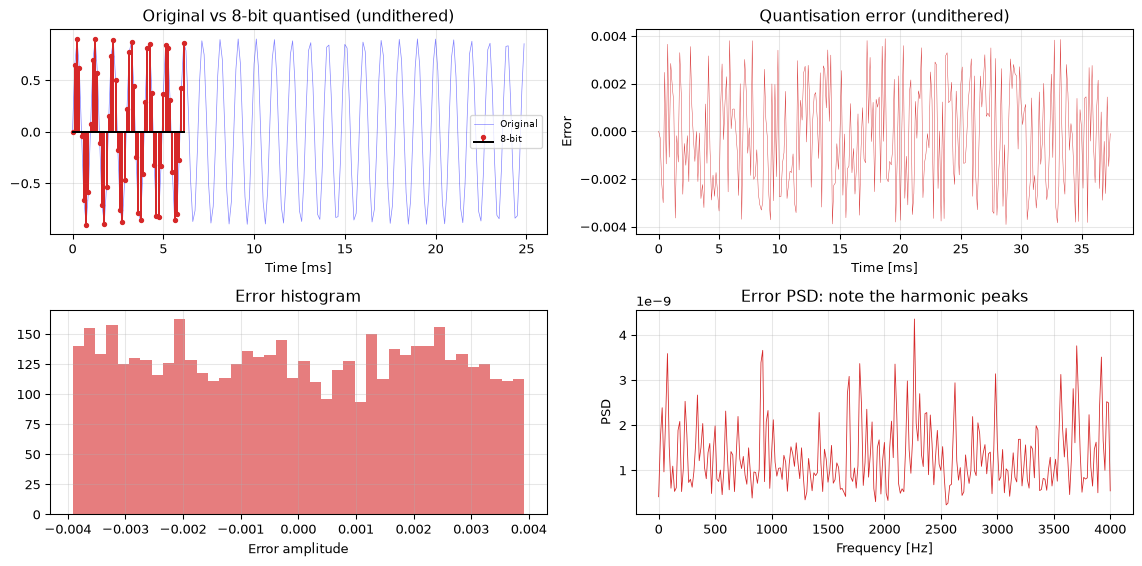
Quantise a pure sinusoid to a small number of bits and look at the error signal. If the error were truly random (as the uniform quantisation noise model assumes), it would have a flat spectrum. It does not; the periodogram shows sharp harmonic peaks. The error is a deterministic function of the input: for a sine wave of a given amplitude and frequency, the same quantisation levels are hit in the same order every cycle. The error pattern repeats, and repetition in time creates lines in frequency.
Figure 1: Undithered 8-bit quantisation of a 1 kHz sine. The error signal (red, bottom-left) is clearly structured, not random. Its PSD (bottom-right) shows sharp harmonic peaks.
Undithered SQNR: 48.9 dB
The histogram confirms the error is roughly uniform. But the PSD tells a different story: those harmonic peaks are the fingerprint of signal-correlated error. The uniform noise model gives the right variance but the wrong spectrum.
Dither types: RPDF and TPDF
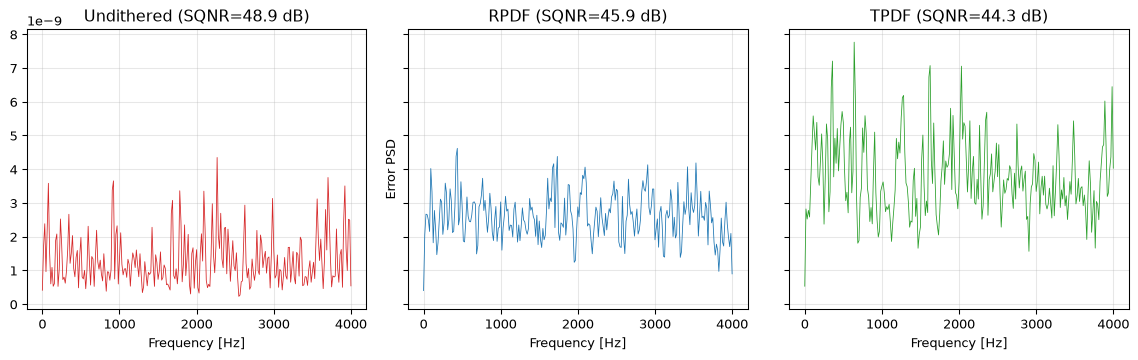
RPDF (rectangular probability density function) dither adds uniform noise on \([-Q/2, Q/2]\), where \(Q\) is the quantisation step. It decorrelates the error from the signal (the harmonic peaks disappear), but it leaves noise modulation: the noise floor varies with the signal amplitude.
TPDF (triangular PDF) dither is the sum of two independent RPDF sources. It eliminates both distortion and noise modulation. The total dither power is \(Q^2/6\) (vs \(Q^2/12\) for RPDF), and the noise floor rises by about 3 dB compared to RPDF, a small price for a clean spectrum that is independent of the signal.
Figure 2: Undithered vs RPDF-dithered vs TPDF-dithered 8-bit quantisation. Undithered shows harmonic peaks. RPDF flattens the spectrum but leaves some structure. TPDF produces a clean, flat noise floor.
Peak-to-median ratio: undithered=6.9, TPDF=2.9
The SQNR cost of dither
Dither adds noise, so the total SQNR drops. For a full-scale sinusoid:
Condition
SQNR formula
8-bit
12-bit
16-bit
Undithered (theoretical)
\(6.02B + 1.76\) dB
49.9
74.0
98.1
RPDF
\(6.02B + 1.76 - 10\log_{10}(2)\) dB
46.9
71.0
95.1
TPDF
\(6.02B + 1.76 - 10\log_{10}(3)\) dB
45.1
69.2
93.3
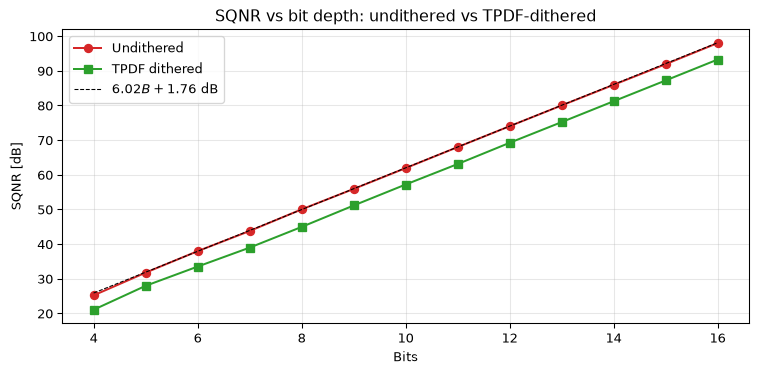
RPDF dither adds \(Q^2/12\) of noise power (doubling the total from quantisation alone), costing about 3 dB. TPDF doubles the dither power again (total noise ×3), costing about 5 dB (less than one bit) for a spectrum free of both harmonic distortion and noise modulation. In audio, the perceptual benefit is enormous (Pohlmann 2011): a dithered 16-bit recording sounds clean, while an undithered 16-bit truncation of a 24-bit master has audible harshness, especially during fades.
Figure 3: SQNR vs bit depth with and without TPDF dither. Dither costs ~5 dB (about 0.8 bits) at all resolutions.
Image dithering: the same principle in 2-D
The same idea works spatially. An 8-bit greyscale image truncated to 1 bit (pure black/white) loses all gradation. Add a dither pattern before thresholding and the spatial averaging of the human visual system reconstructs the greyscale. Floyd-Steinberg error diffusion is the image-processing analogue of noise-shaped dither: it pushes the quantisation error to higher spatial frequencies where the eye is less sensitive.
This is a pointer rather than a full treatment: the image noise topic covers spatial noise models in detail.
When to dither (and when not to)
Dither when: - Reducing bit depth and the output will be listened to or analysed spectrally. - The quantisation is the final step before storage or transmission; the dither decorrelates the error, and a downstream process (the ear, a detector) can average the noise. - You are designing an ADC and need to break up the harmonic structure of the quantisation error (sigma-delta converters use noise shaping to push the dither + quantisation noise out of band; see the ADC noise topic).
Do not dither when: - You are already at a high enough bit depth that the quantisation noise is below the analog noise floor. - The downstream process is a threshold detector that would be triggered by the dither noise. - You are quantising a DC or near-DC signal: dither adds white noise that cannot be averaged away without also averaging the signal.
Connection to stochastic resonance
Dither is a special case of stochastic resonance: a nonlinear system (the quantiser) whose response to a weak input is improved by adding noise. The quantiser with dither is the canonical engineered example; the biological examples (crayfish mechanoreceptors, the barn owl auditory system) are the natural ones. See the stochastic resonance topic for the nonlinear-dynamics treatment.
Open question: optimal dither for non-audio applications
The theory of nonsubtractive dither (Wannamaker et al. 2000) is built around the first two moments of the error: removing distortion and noise modulation. Whether higher moments matter for non-audio applications (radar detection, ADC testing, sensor signal conditioning) is less settled. A TPDF-dithered quantiser is optimal in the first two error moments; whether that is the right optimality criterion for your application is not obvious.
References
Pohlmann, Ken C. 2011. Principles of Digital Audio. 6th ed. McGraw-Hill.
Vanderkooy, John, and Stanley P. Lipshitz. 1984. “Resolution Below the Least Significant Bit in Digital Systems with Dither.”Journal of the Audio Engineering Society 32 (3): 106–13.
Wannamaker, Robert A., Stanley P. Lipshitz, John Vanderkooy, and J. Nelson Wright. 2000. “A Theory of Nonsubtractive Dither.”IEEE Transactions on Signal Processing 48 (2): 499–516.
Source Code
---title: "Dither"subtitle: "Noise that makes quantisation sound better"description-meta: "Adding noise before quantising removes harmonic distortion and resolves detail below the least significant bit. Why TPDF is the right shape."bibliography: ../../references.bib---Truncate a 24-bit audio sample to 16 bits and you get harmonic distortion; the quantisation error is correlated with the signal, and the correlation is not subtle. Add a small amount of noise *before* truncating and the distortion disappears; the result resolves signal detail *below* the least significant bit [@vanderkooy1984resolution]. The noise floor rises by a couple of decibels, but the harmonics are gone.This is **dither**: deliberately adding noise to linearise a nonlinear system. It is one of the few DSP techniques where you add noise to *improve* the result, and it is criminally underexposed in DSP education. The [finite word-length topic](../finite-wordlength/index.qmd) mentions it in passing; this page gives it the treatment it deserves.The companion module `dither.py` implements quantisation with and without dither from first principles.::: {.callout-note title="Prerequisites"}Part of the [noise & stochastic processing arc](../noise-and-stochastic-processing.qmd); the overview gives the reading order.[Noise and SNR](../../basics/03-noise-snr.qmd) (quantisation noise, SQNR, dB) and [finite word-length effects](../finite-wordlength/index.qmd) (the quantisation problem dither solves).:::::: {.callout-tip title="Code"}The implementation is [`dither.py`](dither.py). Save [`test_dither.py`](test_dither.py) beside it and `pytest test_dither.py` runs the checks on it.:::```{python}#| echo: falseimport numpy as npimport matplotlib.pyplot as pltfrom dither import (quantize, quantize_with_dither, measure_distortion_spectrum, sqnr_with_dither)```<hr>## The problem: signal-correlated quantisation errorQuantise a pure sinusoid to a small number of bits and look at the error signal. If the error were truly random (as the uniform quantisation noise model assumes), it would have a flat spectrum. It does not; the periodogram shows sharp harmonic peaks. The error is a deterministic function of the input: for a sine wave of a given amplitude and frequency, the same quantisation levels are hit in the same order every cycle. The error pattern repeats, and repetition in time creates lines in frequency.```{python}#| label: fig-undithered-distortion#| fig-cap: "Undithered 8-bit quantisation of a 1 kHz sine. The error signal (red, bottom-left) is clearly structured, not random. Its PSD (bottom-right) shows sharp harmonic peaks."n =4096fs =8000t = np.arange(n) / fsf_sig =1013# non-coherent to avoid bin-alignment artifactsx =0.9* np.sin(2* np.pi * f_sig * t)xq_u = quantize(x, bits=8)error_u = x - xq_ufig, axes = plt.subplots(2, 2, figsize=(12, 6))# Time domain: signal + quantisedaxes[0, 0].plot(t[:200]*1000, x[:200], 'b-', linewidth=0.5, alpha=0.5, label='Original')axes[0, 0].stem(t[:50]*1000, xq_u[:50], linefmt='C3-', markerfmt='C3.', basefmt='k-', label='8-bit')axes[0, 0].set_title('Original vs 8-bit quantised (undithered)')axes[0, 0].set_xlabel('Time [ms]'); axes[0, 0].legend(fontsize=7); axes[0, 0].grid(True, alpha=0.3)# Error signalaxes[0, 1].plot(t[:300]*1000, error_u[:300], 'C3-', linewidth=0.3)axes[0, 1].set_title('Quantisation error (undithered)')axes[0, 1].set_xlabel('Time [ms]'); axes[0, 1].set_ylabel('Error'); axes[0, 1].grid(True, alpha=0.3)# Error histogramaxes[1, 0].hist(error_u, bins=40, density=True, alpha=0.6, color='C3')axes[1, 0].set_title('Error histogram')axes[1, 0].set_xlabel('Error amplitude'); axes[1, 0].grid(True, alpha=0.3)# Error PSDfrom scipy.signal import welchf_e, psd_e = welch(error_u, fs, nperseg=512)axes[1, 1].plot(f_e, psd_e, 'C3-', linewidth=0.6)axes[1, 1].set_title('Error PSD: note the harmonic peaks')axes[1, 1].set_xlabel('Frequency [Hz]'); axes[1, 1].set_ylabel('PSD'); axes[1, 1].grid(True, alpha=0.3)fig.tight_layout(); plt.show()res_u = measure_distortion_spectrum(x, bits=8, dither_type=None)print(f"Undithered SQNR: {res_u['sqnr_db']:.1f} dB")```The histogram confirms the error is roughly uniform. But the PSD tells a different story: those harmonic peaks are the fingerprint of signal-correlated error. The uniform noise model gives the right *variance* but the wrong *spectrum*.<hr>## Dither types: RPDF and TPDF**RPDF** (rectangular probability density function) dither adds uniform noise on $[-Q/2, Q/2]$, where $Q$ is the quantisation step. It decorrelates the error from the signal (the harmonic peaks disappear), but it leaves **noise modulation**: the noise floor varies with the signal amplitude.**TPDF** (triangular PDF) dither is the sum of two independent RPDF sources. It eliminates both distortion *and* noise modulation. The total dither power is $Q^2/6$ (vs $Q^2/12$ for RPDF), and the noise floor rises by about 3 dB compared to RPDF, a small price for a clean spectrum that is independent of the signal.```{python}#| label: fig-dither-comparison#| fig-cap: "Undithered vs RPDF-dithered vs TPDF-dithered 8-bit quantisation. Undithered shows harmonic peaks. RPDF flattens the spectrum but leaves some structure. TPDF produces a clean, flat noise floor."fig, axes = plt.subplots(1, 3, figsize=(12, 4), sharey=True)for ax, dither_type, label, color inzip( axes, [None, 'rpdf', 'tpdf'], ['Undithered', 'RPDF', 'TPDF'], ['C3', 'C0', 'C2']): xq = quantize(x, bits=8) if dither_type isNoneelse quantize_with_dither(x, bits=8, dither_type=dither_type, seed=1) error = x - xq f_e, psd_e = welch(error, fs, nperseg=512) ax.plot(f_e, psd_e, color=color, linewidth=0.6) sqnr =10*np.log10(np.mean(x**2)/np.mean(error**2)) ax.set_title(f'{label} (SQNR={sqnr:.1f} dB)') ax.set_xlabel('Frequency [Hz]'); ax.grid(True, alpha=0.3)if dither_type =='rpdf': ax.set_ylabel('Error PSD')fig.tight_layout(); plt.show()# Verify: TPDF should have fewer PSD peaks than undithered.res_u = measure_distortion_spectrum(x, bits=8, dither_type=None)res_t = measure_distortion_spectrum(x, bits=8, dither_type='tpdf', seed=1)pmr_u = np.max(res_u['psd_error'][10:]) / np.median(res_u['psd_error'][10:])pmr_t = np.max(res_t['psd_error'][10:]) / np.median(res_t['psd_error'][10:])print(f"Peak-to-median ratio: undithered={pmr_u:.1f}, TPDF={pmr_t:.1f}")assert pmr_t < pmr_u, "TPDF dither should flatten the error spectrum"```<hr>## The SQNR cost of ditherDither adds noise, so the total SQNR drops. For a full-scale sinusoid:| Condition | SQNR formula | 8-bit | 12-bit | 16-bit ||---|---|---|---|---|| Undithered (theoretical) | $6.02B + 1.76$ dB | 49.9 | 74.0 | 98.1 || RPDF | $6.02B + 1.76 - 10\log_{10}(2)$ dB | 46.9 | 71.0 | 95.1 || TPDF | $6.02B + 1.76 - 10\log_{10}(3)$ dB | 45.1 | 69.2 | 93.3 |RPDF dither adds $Q^2/12$ of noise power (doubling the total from quantisation alone), costing about 3 dB. TPDF doubles the dither power again (total noise ×3), costing about 5 dB (less than one bit) for a spectrum free of both harmonic distortion and noise modulation. In audio, the perceptual benefit is enormous [@pohlmann2011principles]: a dithered 16-bit recording sounds clean, while an undithered 16-bit truncation of a 24-bit master has audible harshness, especially during fades.```{python}#| label: fig-dither-vs-bits#| fig-cap: "SQNR vs bit depth with and without TPDF dither. Dither costs ~5 dB (about 0.8 bits) at all resolutions."bits = np.arange(4, 17)sqnr_undithered = []sqnr_tpdf = []for b in bits: n_test =min(8192, 2**(b+2)) x_test =0.99* np.sin(2* np.pi *313* np.arange(n_test) /8000) sqnr_undithered.append(10*np.log10(np.mean(x_test**2)/np.mean((x_test - quantize(x_test, b))**2))) sqnr_tpdf.append(sqnr_with_dither(x_test, b, dither_type='tpdf', seed=1))fig, ax = plt.subplots(figsize=(8, 4))ax.plot(bits, sqnr_undithered, 'C3o-', label='Undithered', markersize=6)ax.plot(bits, sqnr_tpdf, 'C2s-', label='TPDF dithered', markersize=6)ax.plot(bits, 6.02*bits +1.76, 'k--', linewidth=0.8, label='$6.02B + 1.76$ dB')ax.set_xlabel('Bits'); ax.set_ylabel('SQNR [dB]')ax.set_title('SQNR vs bit depth: undithered vs TPDF-dithered')ax.legend(); ax.grid(True, alpha=0.3)fig.tight_layout(); plt.show()```<hr>## Image dithering: the same principle in 2-DThe same idea works spatially. An 8-bit greyscale image truncated to 1 bit (pure black/white) loses all gradation. Add a dither pattern before thresholding and the spatial averaging of the human visual system reconstructs the greyscale. Floyd-Steinberg error diffusion is the image-processing analogue of noise-shaped dither: it pushes the quantisation error to higher spatial frequencies where the eye is less sensitive.This is a pointer rather than a full treatment: the [image noise topic](../image-noise/index.qmd) covers spatial noise models in detail.<hr>## When to dither (and when not to)**Dither when:**- Reducing bit depth and the output will be listened to or analysed spectrally.- The quantisation is the final step before storage or transmission; the dither decorrelates the error, and a downstream process (the ear, a detector) can average the noise.- You are designing an ADC and need to break up the harmonic structure of the quantisation error (sigma-delta converters use noise shaping to push the dither + quantisation noise out of band; see the [ADC noise topic](../adc-noise/index.qmd)).**Do not dither when:**- You are already at a high enough bit depth that the quantisation noise is below the analog noise floor.- The downstream process is a threshold detector that would be triggered by the dither noise.- You are quantising a DC or near-DC signal: dither adds white noise that cannot be averaged away without also averaging the signal.<hr>## Connection to stochastic resonanceDither is a special case of **stochastic resonance**: a nonlinear system (the quantiser) whose response to a weak input is improved by adding noise. The quantiser with dither is the canonical engineered example; the biological examples (crayfish mechanoreceptors, the barn owl auditory system) are the natural ones. See the [stochastic resonance topic](../stochastic-resonance/index.qmd) for the nonlinear-dynamics treatment.<hr>## Going further- **[Finite word-length effects](../finite-wordlength/index.qmd)**: dither is mentioned there in passing; this page is the expansion.- **[ADC noise](../adc-noise/index.qmd)**: noise shaping takes dither into the sigma-delta conversion pipeline.- **[Noise generation](../noise-generation/index.qmd)**: the dither noise sources you need to generate.- **[Stochastic resonance](../stochastic-resonance/index.qmd)**: dither as SR in a deterministic nonlinearity.::: {.callout-warning title="Open question: optimal dither for non-audio applications"}The theory of nonsubtractive dither [@wannamaker2000theory] is built around the first two moments of the error: removing distortion and noise modulation. Whether higher moments matter for non-audio applications (radar detection, ADC testing, sensor signal conditioning) is less settled. A TPDF-dithered quantiser is optimal in the first two error moments; whether that is the right optimality criterion for your application is not obvious.:::## References::: {#refs}:::